Individual Reviews
Individual reviews let you examine each respondent's answers separately — as opposed to summary statistics, which show an aggregated picture.
How to open
Open your project and go to the Results tab in the top navigation. In the left panel, select Individual Review.
The responses table
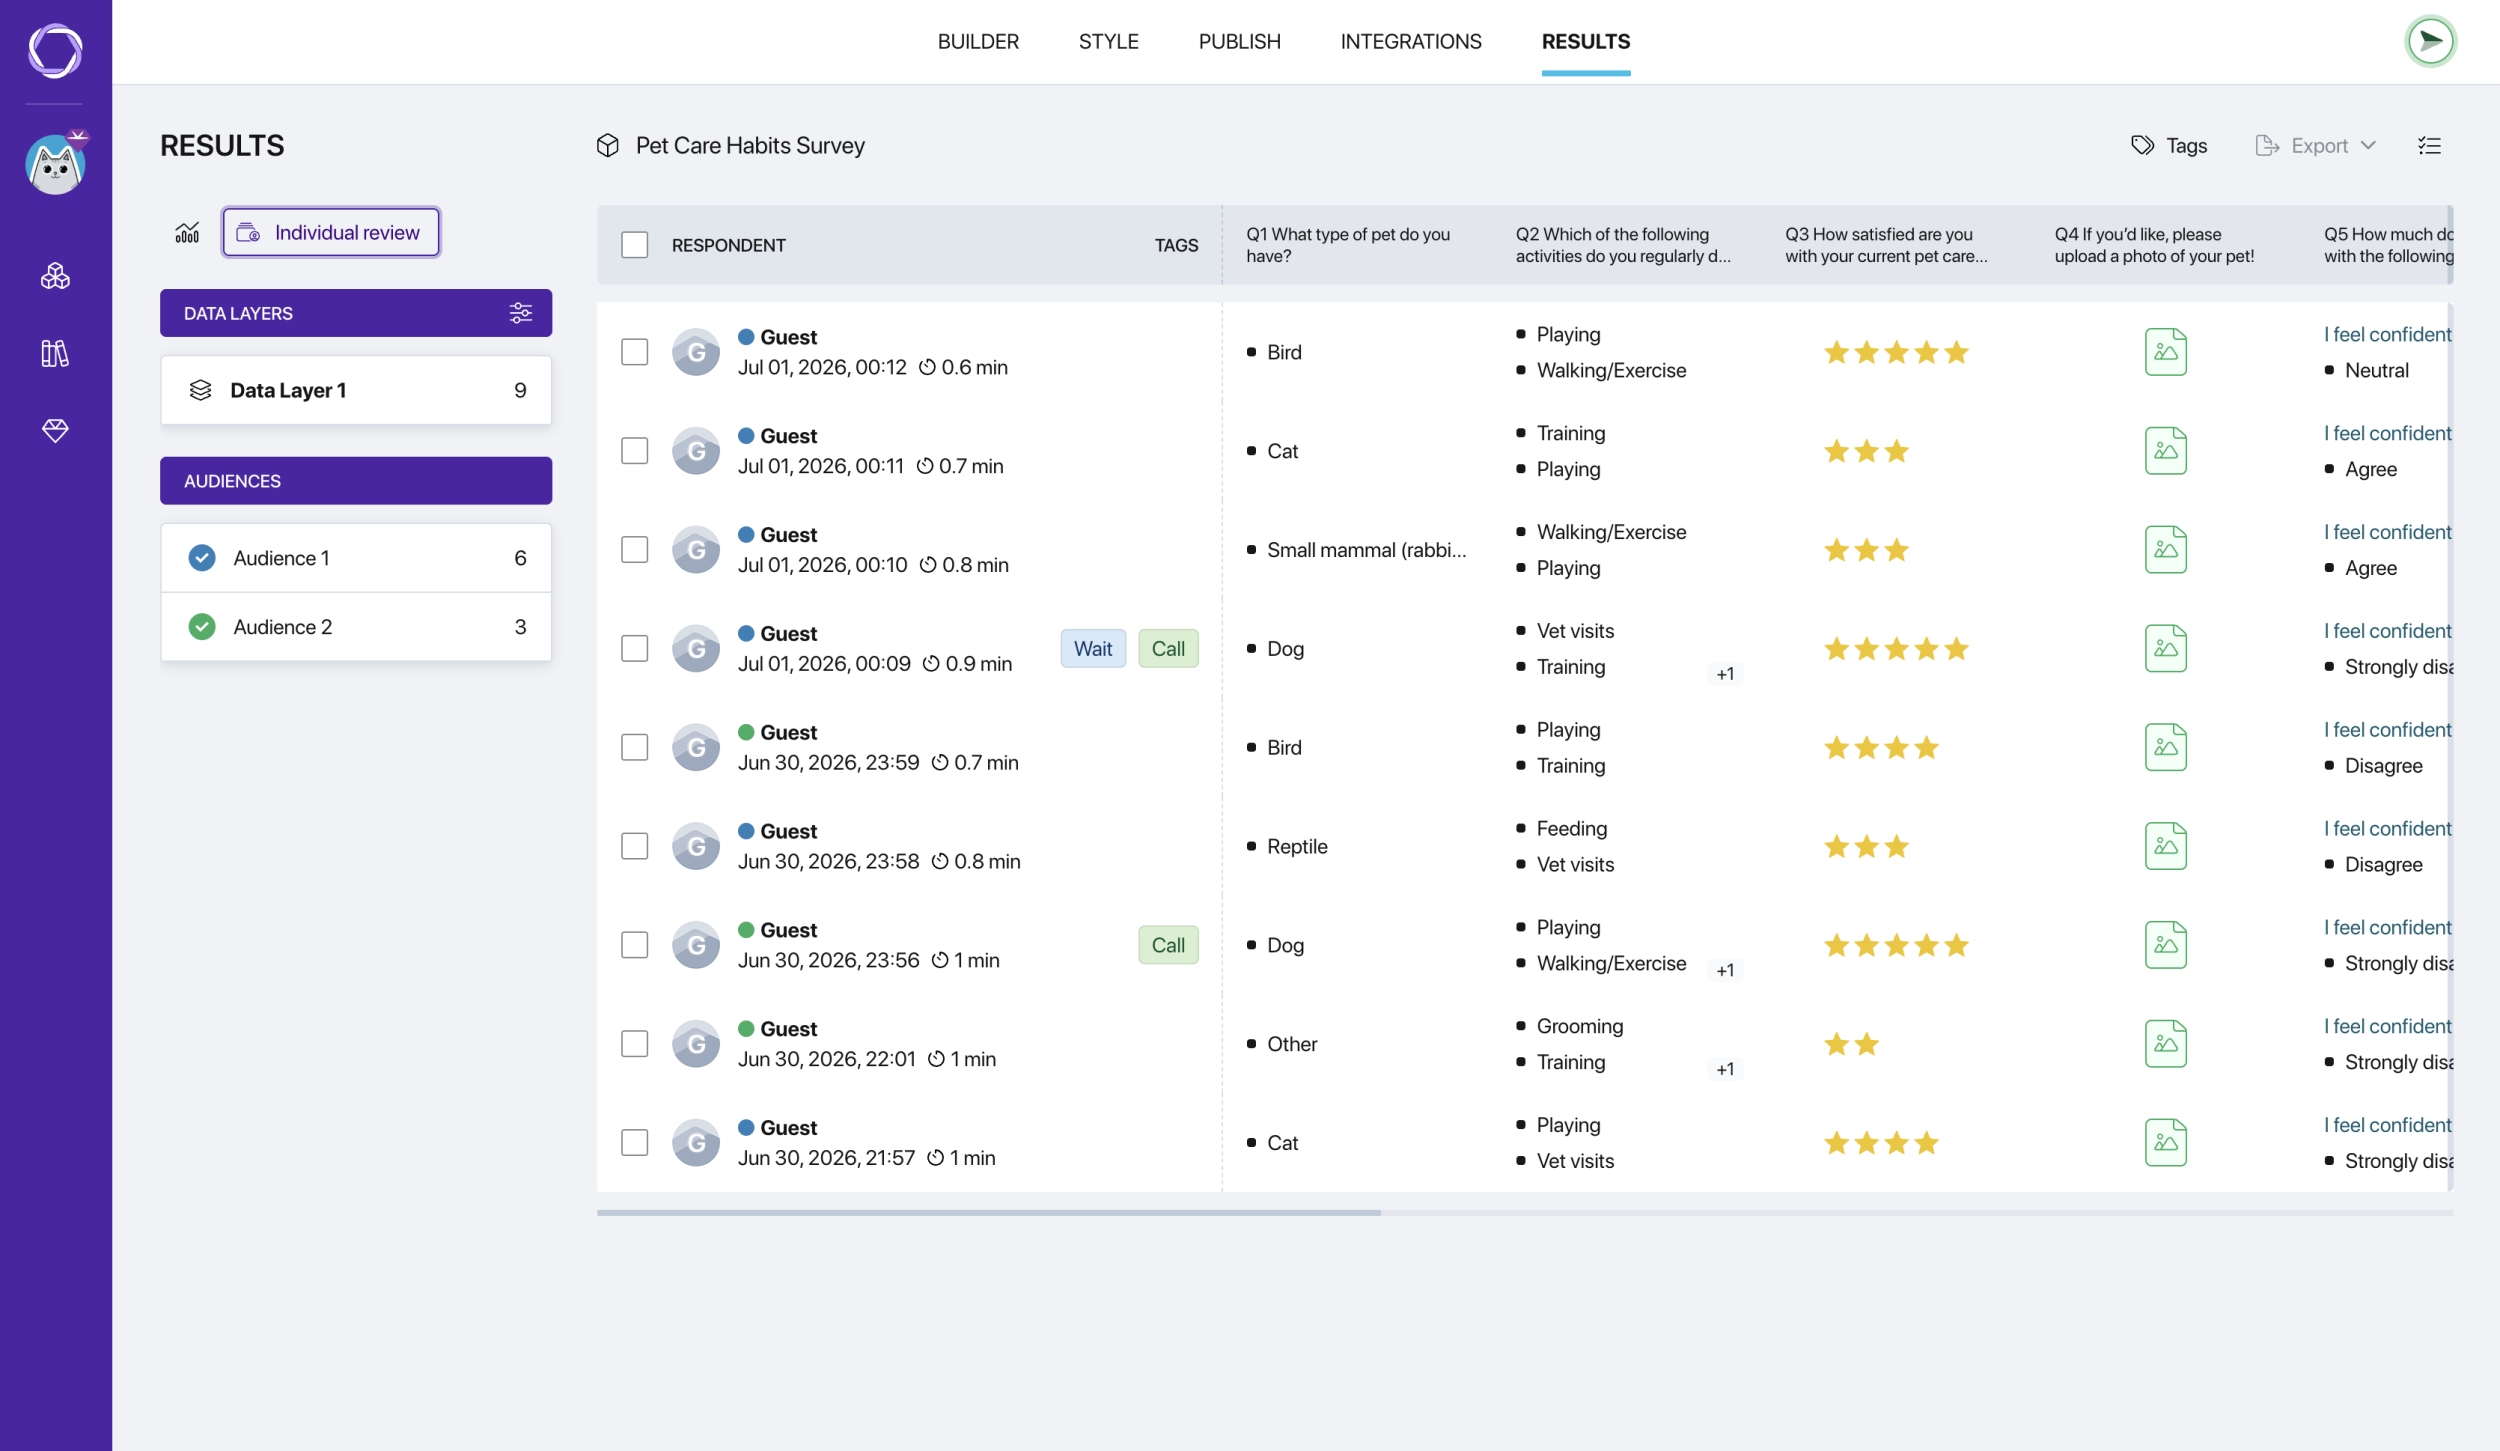
The responses table
Each row in the table is one completed response. The table shows:
- Checkbox — for selecting responses. The checkbox in the header selects all at once
- Respondent — avatar, name (Guest for anonymous), colored audience dot, date and time of completion, duration
- Tags — tags assigned to this response
- Url_utm_tag — the UTM tag value, if the respondent arrived via a link with a UTM parameter
- Q1–Qn — columns with answers to each question
- Columns with the final values of user variables (if the survey has any)
To delete one or more responses, select the relevant rows using the checkboxes — the delete button at the top of the table will become active. This is useful for removing test runs, as well as filtering out unwanted or low-quality responses.
Customizing visible columns
Click the column settings icon in the top right corner of the table. A panel with checkboxes will open — choose which columns to show: questions (Q1–Qn), tags, UTM, user variables. All are enabled by default.
Respondent card
Click any row in the table to open the full response card for that respondent.
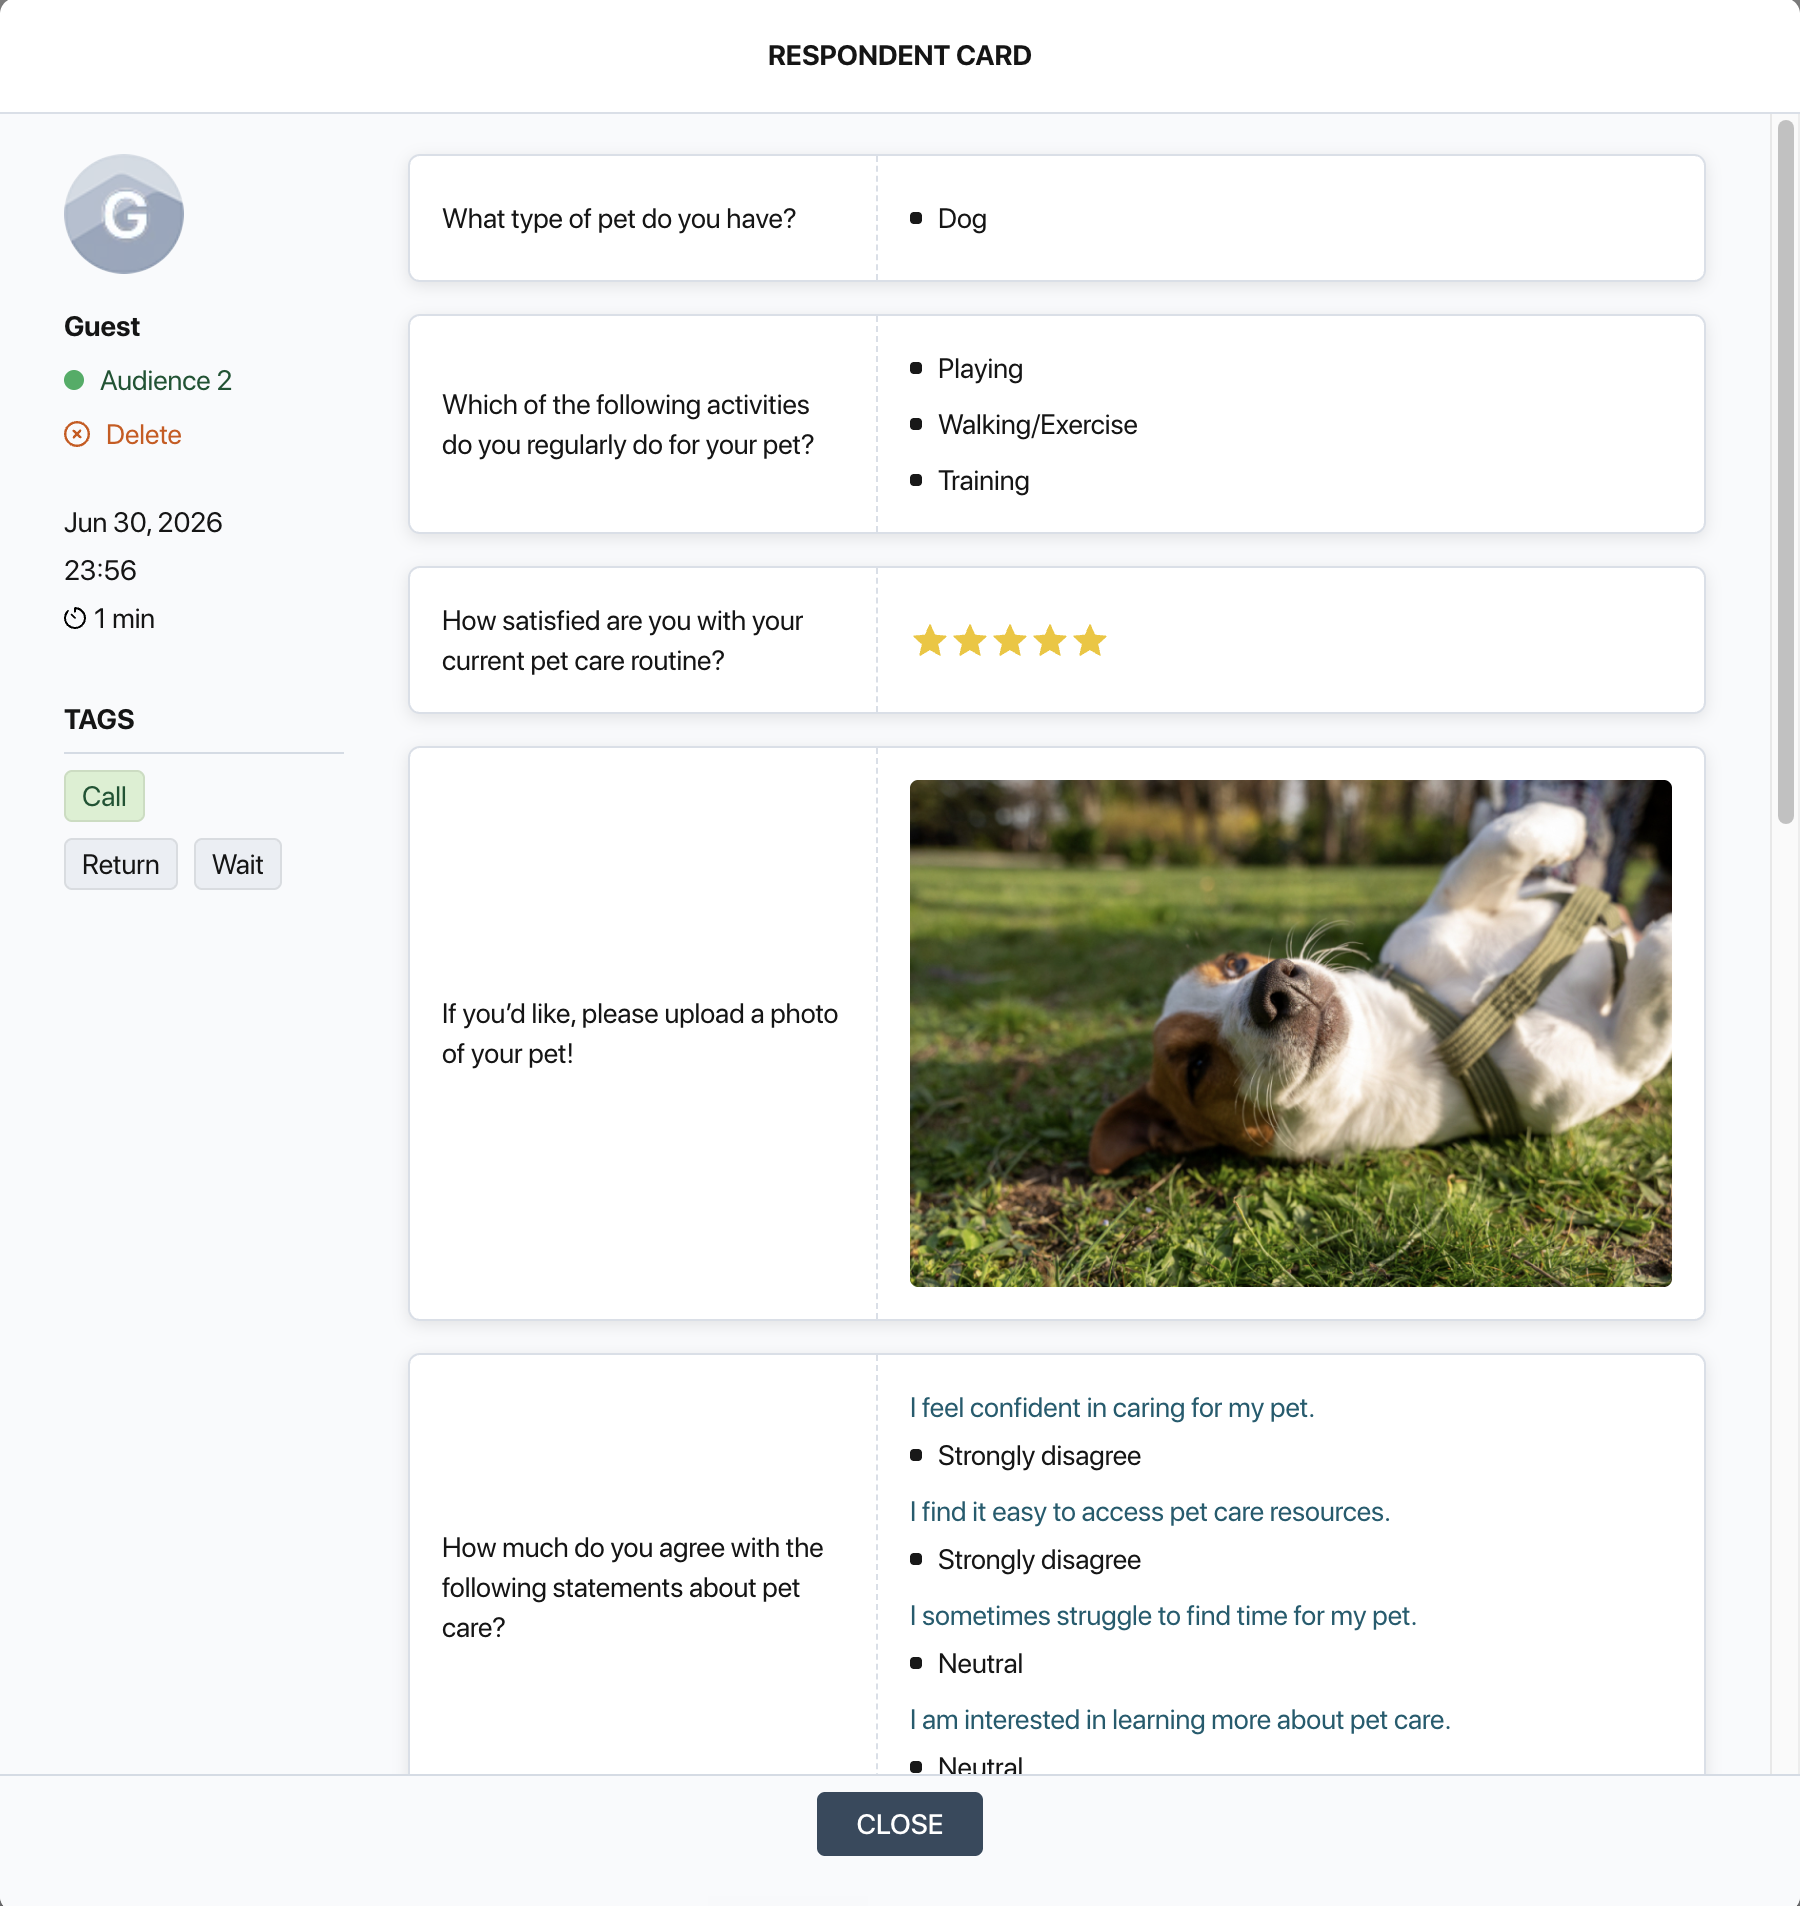
Respondent card
Left side of the card:
- Avatar and respondent name
- Colored dot and audience name
- Date, time, and duration of completion
- Delete button to remove the response
- Tags block — assign and remove tags for this response here
Right side of the card — the respondent's answers. A list of all questions with this respondent's answers, each shown in the format that fits its question type; a skipped question appears as a dash.
If the respondent arrived via a link with a UTM tag, the card shows the source name and its value.
At the bottom of the card — the Variables block with the final values of all user variables for this respondent.
Tags
Tags help you manually annotate responses: mark high-quality answers, flag special cases, and filter the responses you need during analysis.

Tags can only be assigned from the respondent card — not from the main table. Click a tag in the card's tags block to assign or remove it.
Managing project tags
Click the Tags button at the top of the page to open the tag manager.
There are two levels of tags:
- Default tags — applied across all of the author's projects. Managed in the "Default Settings" section
- Project tags — available only within this specific project. Created directly here
To create a new project tag, type a name in the field and press Enter. The tag will appear in the list and become available for assignment in respondent cards.
Exporting responses
To export responses, select the relevant rows using the checkboxes — the Export button will become active. Choose a format: CSV, XLSX, JSON, or PDF.
If no rows are selected, the export button is inactive.