Summary statistics
Summary statistics is an aggregated view of all responses at once: distribution across options, percentages, charts. It is convenient here to assess the overall picture and notice trends.
How to open
Go to the Results tab in the top navigation of the builder. In the left panel, select Summary data.
Questions are displayed sequentially from top to bottom, each in its own collapsible block.
Table and charts
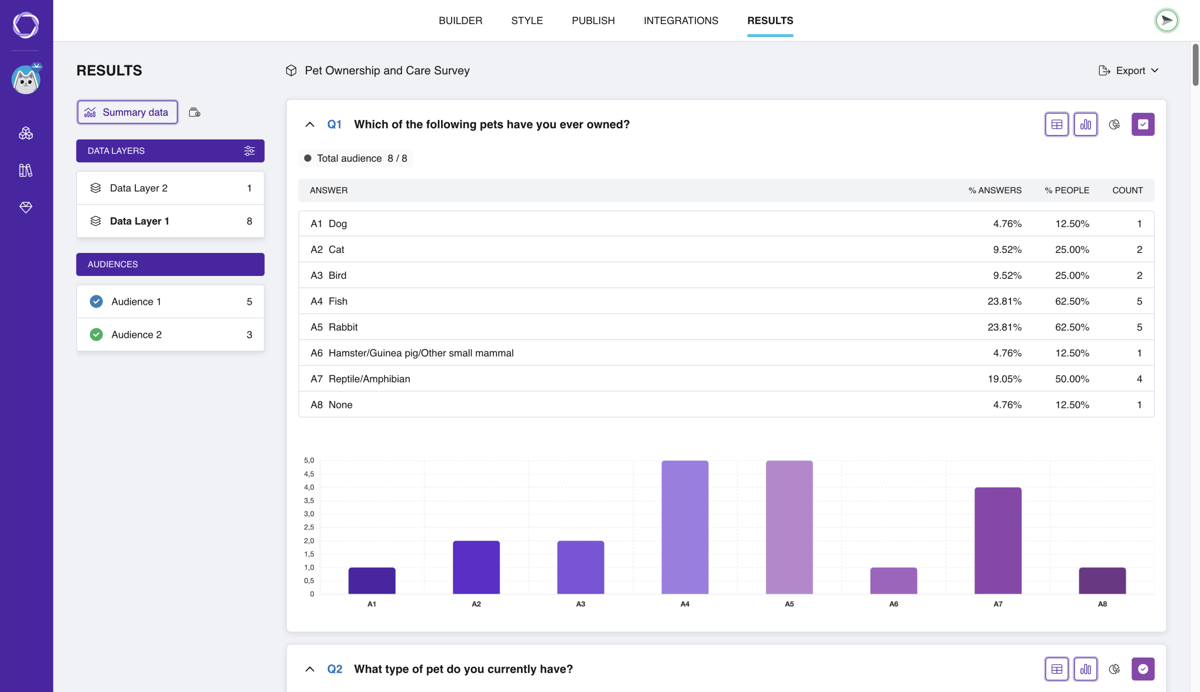
A question block in summary statistics
Each question block has three data display modes:
- Table — turns on and off independently
- Bar chart and Pie chart — mutually exclusive: choose one of the two or turn both off
For example, you can view the table and the bar chart at the same time — or only the pie chart without the table.
Chart colors are chosen automatically: for rating questions (Yes/No, NPS®, Rating, Multiple rating) — a gradient from green to red, for the rest — a palette of shades (smooth transitions between tints of a single color).
Data by question type
Yes/No
| Column | What it shows |
|---|---|
| Answer | Answer option — Positive or Negative — with an icon |
| % answers | Share of this option out of all responses |
| Count | Number of responses |
Single choice
| Column | What it shows |
|---|---|
| Answer | Answer option (A1, A2…) |
| % answers | Share of the option out of all responses |
| Count | Number of responses |
Multiple choice
One respondent can select several options, so there are two columns with percentages here.
| Column | What it shows |
|---|---|
| Answer | Answer option |
| % answers | Share of the option out of the total number of all selections |
| % people | Share of respondents who chose this option |
| Count | How many times this option was chosen |
Single matrix
Each statement forms a group of rows — one per answer option.
| Column | What it shows |
|---|---|
| Statement | Statement (T1, T2…) |
| Answer | Answer option for this statement |
| % answers | Share of the answer among all responses to this statement |
| Count | Number of responses |
Multiple matrix
Similar to Single matrix, but a column is added to account for multiple selection. If illustrations are attached to the statements, thumbnails are displayed next to them.
| Column | What it shows |
|---|---|
| Statement | Statement (T1, T2…) |
| Answer | Answer option |
| % answers | Share of the answer out of the total number of selections for this statement |
| % people | Share of respondents who chose this answer for this statement |
| Count | How many times this option was chosen for this statement |
NPS®
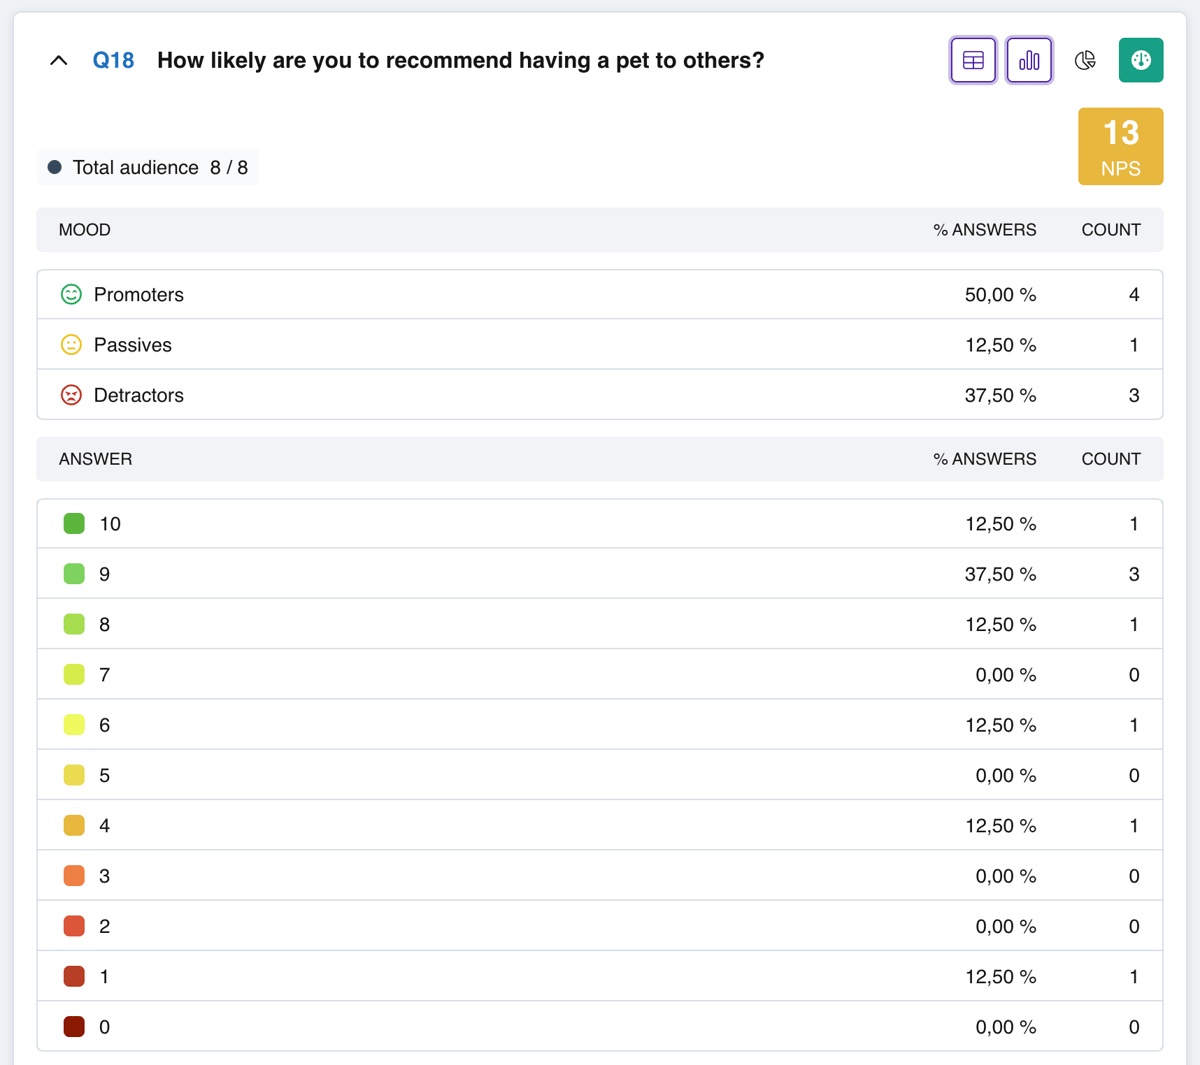
The NPS statistics block
In the top-right corner of the block is the NPS score: the difference between the share of promoters and the share of detractors, in percentage points.
Below the score are two tables.
Groups table:
| Column | What it shows |
|---|---|
| Mood | Group: Promoters (9–10, green), Passives (7–8, yellow), Detractors (0–6, red) |
| % answers | Share of respondents in this group |
| Count | Number of respondents in this group |
Values table:
| Column | What it shows |
|---|---|
| Answer | A specific numeric value of the scale (from 10 to 0) with a color indicator |
| % answers | Share of this value out of all responses |
| Count | Number of responses with this value |
Rating
Rows go from the maximum value to the minimum. Icons match the type chosen when creating the question — star, heart, trophy, etc.
| Column | What it shows |
|---|---|
| Answer | Rating value, shown as icons |
| % answers | Share of this value out of all responses |
| Count | Number of responses with this rating |
Multiple rating
Each item to be rated forms a group of rows. The average score is shown in the item row.
| Column | What it shows |
|---|---|
| Statement | Item name (A1, A2…) |
| Answer | Rating value for this item |
| Average | Average score for the item |
| % answers | Share of the value among responses for this item |
| Count | Number of responses with this value |
Emotions
| Column | What it shows |
|---|---|
| Answer | Emotion option with a colored icon: Great, Ok, Bad |
| % answers | Share of the option out of all responses |
| Count | Number of responses with this option |
Ranking
Each row is one answer option. The number of position columns depends on the number of options in the question.
| Column | What it shows |
|---|---|
| Answer | Option text (A1, A2…) |
| 1, 2, 3… | One column per position — the number of respondents who placed this option at this position |
| Average | Average score of the option: the higher the score, the higher the option ranks overall. |
| Priority | The option's final priority as a percentage — its relative importance compared to the others. The higher the percentage, the higher the priority; rows are sorted by descending priority. |
Slider
Identical values are aggregated. If there are many values, the list is split across pages.
| Column | What it shows |
|---|---|
| Answer | Numeric value selected with the slider |
| % answers | Share of the value out of all responses |
| Count | Number of responses with this value |
If the question is set to Dual Range mode, the Answer column shows a range — for example, «120 – 140».
Number
The table is identical to Slider: columns Answer, % answers, Count. If there are many values, the list is split across pages.
Text, Phone, Email
For these types, charts are not available — only a list of answers in the Answer column. If there are many responses, the list is split across pages.
Location
Identical addresses are aggregated.
| Column | What it shows |
|---|---|
| Answer | Address with the level of detail from the question settings: country, region and/or city |
| % answers | Share of this address out of all responses |
| Count | Number of responses with this address |
Date
Identical dates are aggregated.
| Column | What it shows |
|---|---|
| Answer | Selected date |
| % answers | Share of this date out of all responses |
| Count | Number of responses with this date |
File upload

Group
A question group is displayed as a collapsible container with a heading. Inside — full statistics for each question in the group with the same visualization modes.
Filtering by audiences
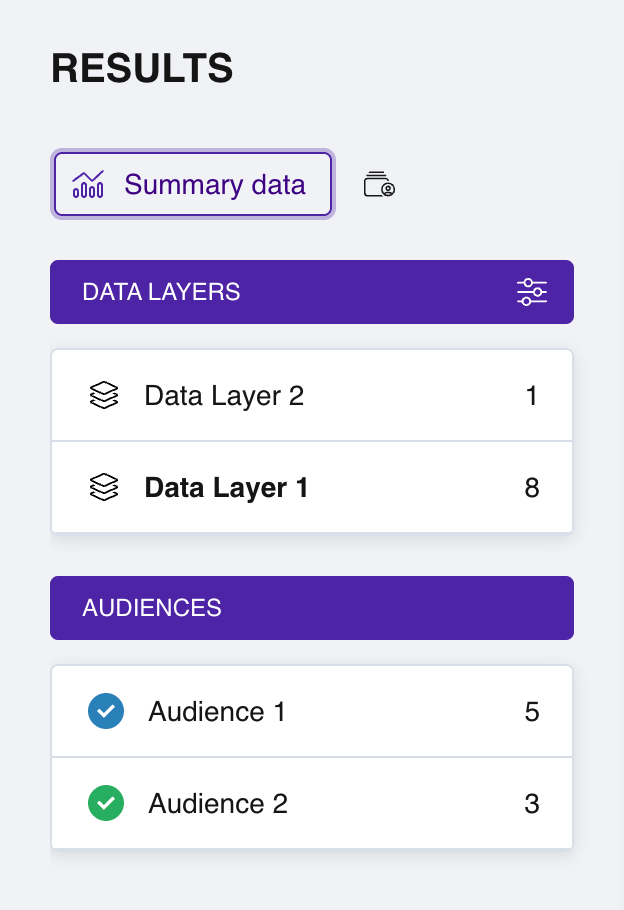
The Results left panel with the list of audiences
If a survey has several audiences, a list of them with checkboxes appears in the left panel. Turn the ones you need on and off — the statistics will recalculate automatically.
Each question block shows a label indicating the context of the current data:
- All audiences enabled — «Total audience»
- Only one enabled — its name is shown
- Several but not all enabled — «Joint audience»
Data from several selected audiences is summed.
Export
Above the statistics blocks, on the right, there is an export button (a document icon). Click it and choose a format from the drop-down menu:
- JSON — structured data for transferring to other services or for programmatic processing.
- CSV — a universal table that opens in any spreadsheet editor (Excel, Google Sheets, Numbers).
- XLSX — a ready-to-use Excel file with formatting.
The export includes the summary data currently displayed, taking into account the selected audiences (see the section above). This way you can export, for example, statistics for a single audience.